Difference between revisions of "Parallel Debugging with DDT"
(Created page with "=Overview of DDT= ==Introduction== The Distributed Debugging Tool (DDT) is a powerful commercial debugger with a graphical user interface (GUI). It’s main intended use is...") |
|||
| Line 255: | Line 255: | ||
*Can be a mixed MPI/CUDA code, but can only use one CPU and one GPU per node, up to 8 nodes. | *Can be a mixed MPI/CUDA code, but can only use one CPU and one GPU per node, up to 8 nodes. | ||
[[File: | [[File:Ddt_wiki21.jpg]] | ||
[[Category:Tutorials]] | [[Category:Tutorials]] | ||
<!--checked2016--> | <!--checked2016--> | ||
Latest revision as of 15:26, 18 March 2021
Overview of DDT
Introduction
The Distributed Debugging Tool (DDT) is a powerful commercial debugger with a graphical user interface (GUI). It’s main intended use is for debugging parallel MPI codes, though it can also be used with serial, threaded (OpenMP / pthreads), and GPU (CUDA; also mixed MPI and CUDA) programs. The product was developed by Allinea (U.K.). It is installed on Graham cluster. The DDT software page can be found here.
DDT supports C, C++, and Fortran 77 / 90 / 95 / 2003. Detailed documentation (the User Guide) is available as a PDF file on Graham, in
${EBROOTALLINEA}/doc
(One has to load the corresponding module first; see below.)
Preparing your program
The code has to be compiled with the switch -g, which tells the compiler to generate symbolic information required by any debugger. Normally, all optimizations have to be turned off. For example,
f77 -g -O0 -o program program.f
mpicc -g -O0 -o code code.c
For CUDA code, you can first compile the CUDA part (*.cu files) using nvcc,
nvcc -g -G -c cuda_code.cu
and then link with the non-CUDA part of the code, using cc for serial
cc -g main.c cuda_code.o -lcudart
or mpicc for mixed MPI/CUDA code:
mpicc -g main.c cuda_code.o -lcudart
Launching DDT
DDT is a GUI application, so one has to set up the environment properly to run X-windows (graphical) applications on Graham:
- Microsoft Windows: use free mobaxterm app
- Linux / Unix: nothing to install
- Mac: install a free app XQuartz
In all cases, add "-Y" to all your ssh commands, for X11 tunelling.
DDT is an interactive GUI application, so before using it one has to first allocate a compute node (or nodes) with salloc, e.g.
salloc -A account_name --x11 --time=0-3:00 --mem-per-cpu=4G --ntasks=4  (for CPU codes)
salloc -A account_name --x11 --time=0-3:00 --mem-per-cpu=4G --ntasks=1 --gres=gpu:1  (for GPU codes)
Once the resource becomes available, load the corresponding DDT module:
module load allinea-cpu  , or
module load allinea-gpu
For MPI codes, one also has to execute the following command:
export OMPI_MCA_pml=ob1
or else the Message queue display feature will not work.
To debug a code, simply type
ddt program [optional arguments]
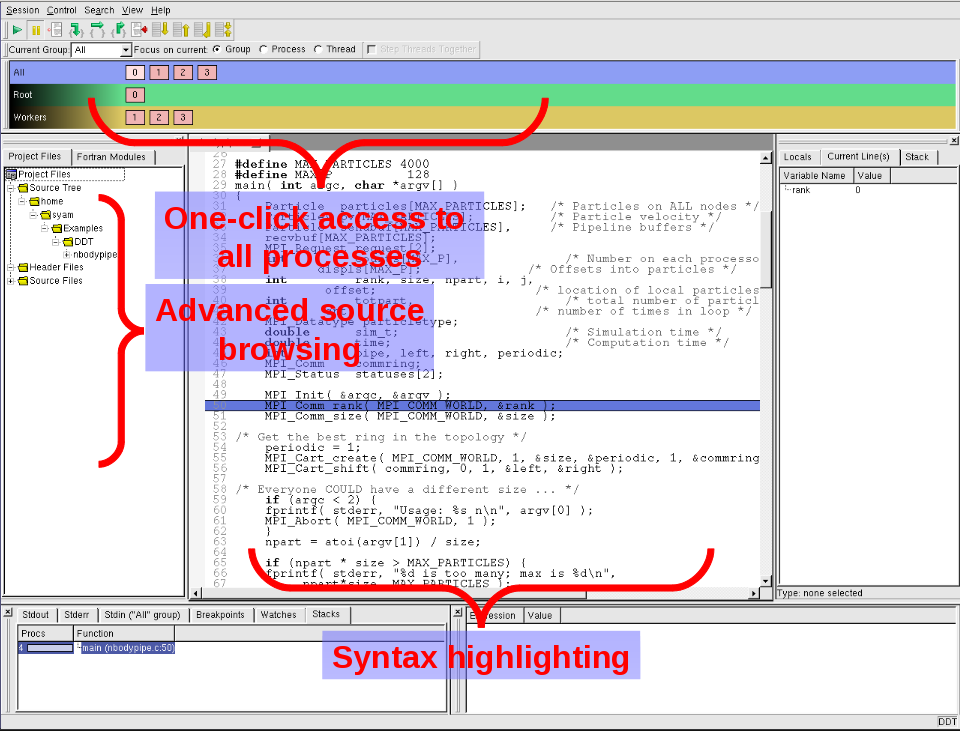
After a couple of seconds, you will be presented with the following window:
User interface
DDT uses a tabbed-document interface. Each component of DDT is a dockable window, which may be dragged around by a handle. Components can also be double-clicked, or dragged outside of DDT, to form a new window. Some of the user-modified parameters and windows are saved by right-clicking and selecting a save option in the corresponding window (Groups; Evaluations; Breakpoints etc).
DDT also has the ability to load and save all these options concurrently to minimize the inconvenience in restarting sessions. Saving the session stores such things as process groups, the contents of the Evaluate window and more. When DDT begins a session, source code is automatically found from the information compiled in the executable.
The "Find" and "Find In Files" dialogs are found from the "Search" menu. The "Find" dialog will find occurrences of an expression in the currently visible source file. The "Find In Files" dialog searches all source and header files associated with your program and lists the matches in a result box. Click on a match to display the file in the main Source Code window and highlight the matching line.
DDT has a "Goto line" function which enables the user to go directly to a line of code (in the "Search" menu, or Ctrl-G).
Controlling Program Execution
- Process Control And Process Groups:
- Ability to group many process together, with a one-click access to the whole group
- Three predefined groups: All, Root, Workers. (Newest DDT versions only have one group - All).
- Groups can be created, deleted, or modified by the user at any time
- Starting, Stopping And Restarting A Program
- Session Control dialog
- Stepping Through A Program
- Play/Continue, Pause, Step Into, Step Over, Step Out
- Setting Breakpoints
- All breakpoints are listed under the breakpoints tab.
- You can suspend, jump to, delete, load or save breakpoints.
- Breakpoints can easily be made conditional:
- Synchronizing Processes in a Group
- "Run to here" command (right mouse click)
- Can work with individual processes or threads (by changing “Focus”)
- Setting A Watch (for the current process)
- Working with stacks
- Moving (Down / Up / Bottom Stack Frame)
- Aligning of stacks for parallel codes (Ctrl-A)
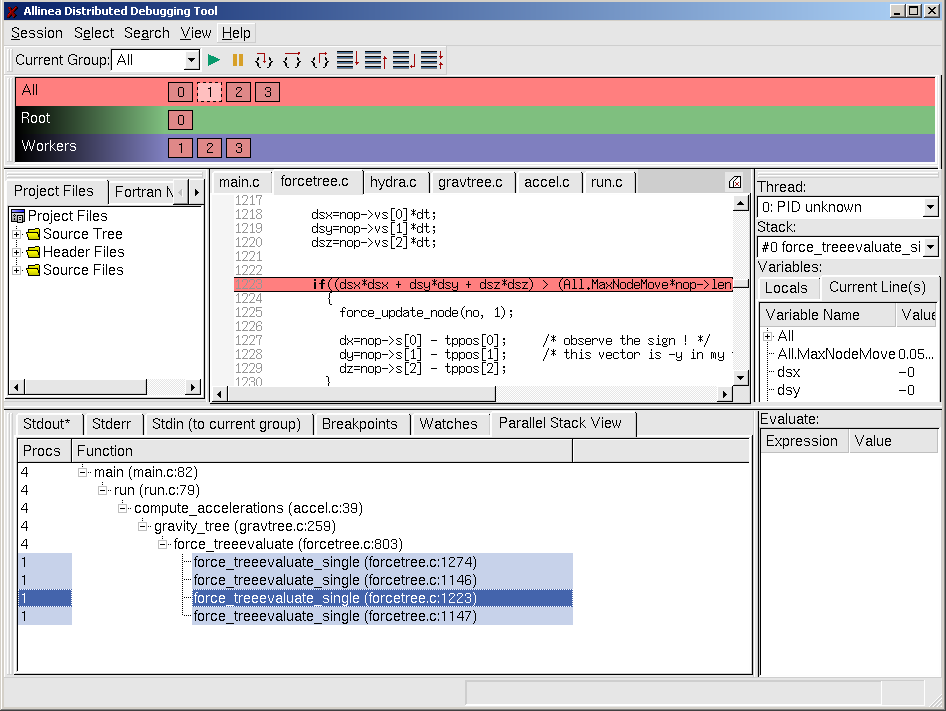
- Viewing Stacks in Parallel
- Stacks tab.
- Shows a tree of functions, merged from every process in the group
- Click on any branch to see its location in the Source Code viewer
- Hover the mouse to see the list of the process ranks at this location in the code
- Can automatically gather the processes at a function together in a new group
- Browsing Source Code
- Highlights the current source line
- Different color coding for synchronous and asynchronous state in the group
- Simultaneously Viewing Multiple Files
- Right click to split the source window into two or more, with each one having its own set of tabs.
- Signal Handling: will stop on the following signals:
- SIGSEGV (segmentation fault)
- SIGFPE (Floating Point Exception)
- SIGPIPE (Broken Pipe)
- SIGILL (Illegal Instruction)
- To enable FPE handling, extra compiler options are required:
- Intel: -fp0
Variables and data
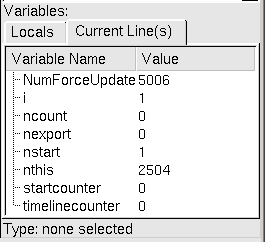
- Current Line tab
- Viewing all the variable for the current line(s) (click and drag for multiple lines)
- Locals tab
- Shows all local variables for the process
- Evaluate window
- Can be used to view values for arbitrary expressions and global variables
- Support for Fortran modules
- Fortran Modules tab in the Project Navigator window
- Changing Data Values
- Right-click and select "Edit value" (in Evaluate window)
- Examining Pointers
- Drag a pointer into the Evaluate window
- Can be viewed as Vector, Reference, or Dereference (right-click to choose).
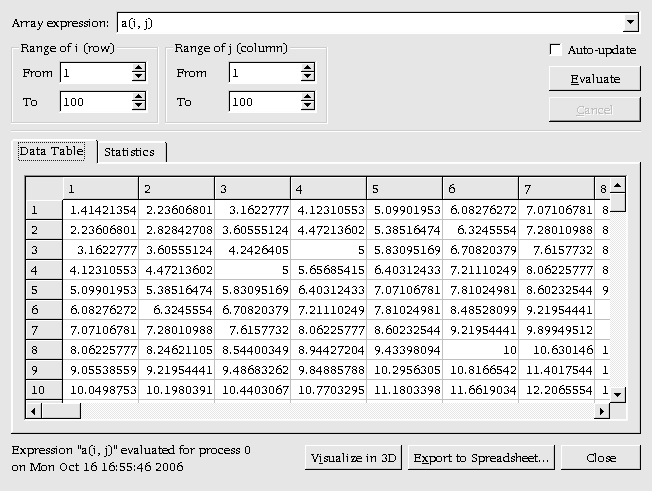
- Multi-Dimensional Arrays
- Can be viewed in the Variable View
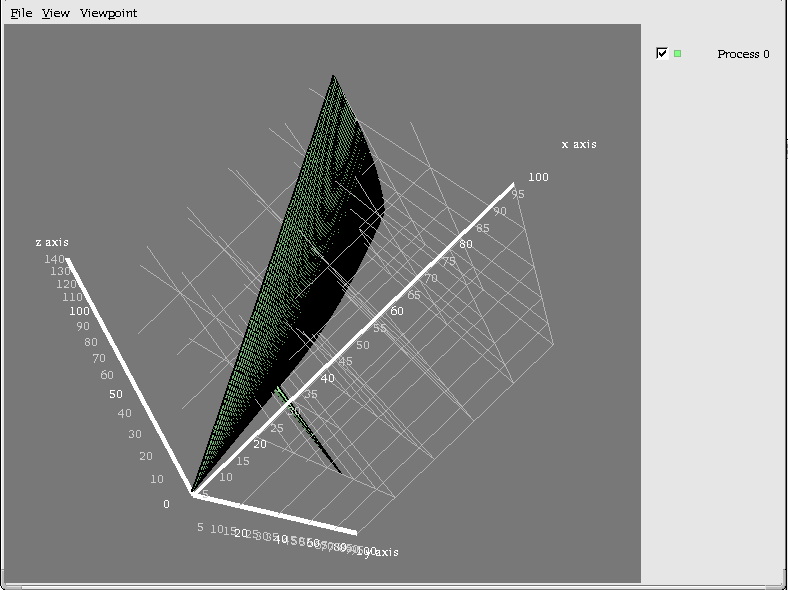
- Multi-Dimensional Array viewer – visualization of a 2-D slice of an array using OpenGL
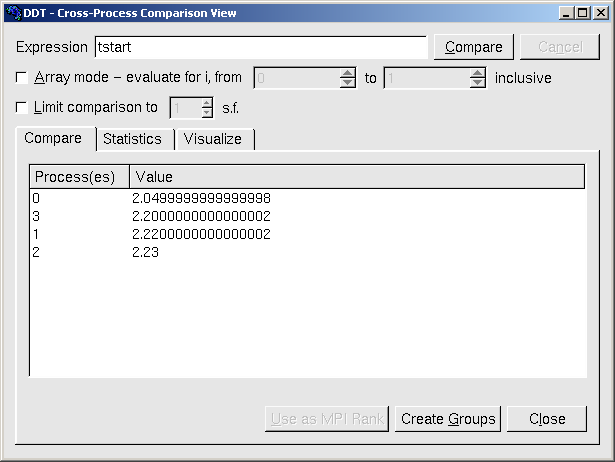
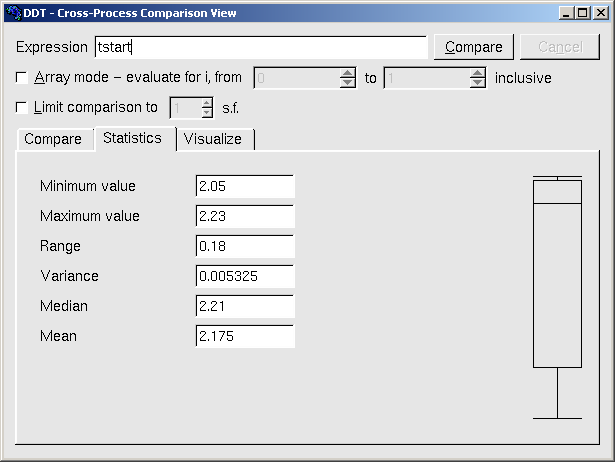
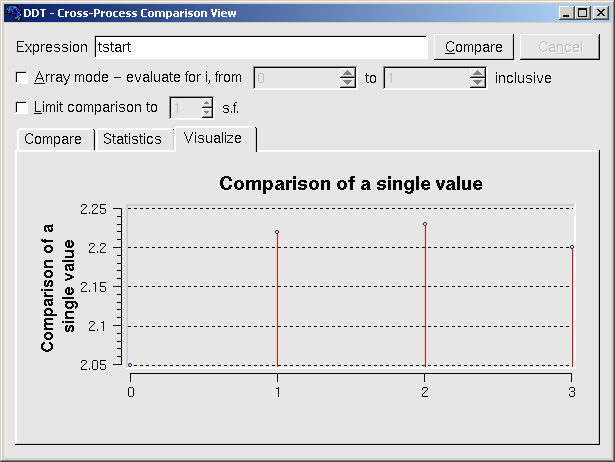
- Cross-Process Comparison
- Right-click on a variable name, or
- From View menu: Cross-Process/Thread Comparison (type in any valid expression)
- Three modes – Compare, Statistics, and Visualize
Message queues
Attention: this feature will not work on graham unless this command is executed first, before running ddt:
export OMPI_MCA_pml=ob1
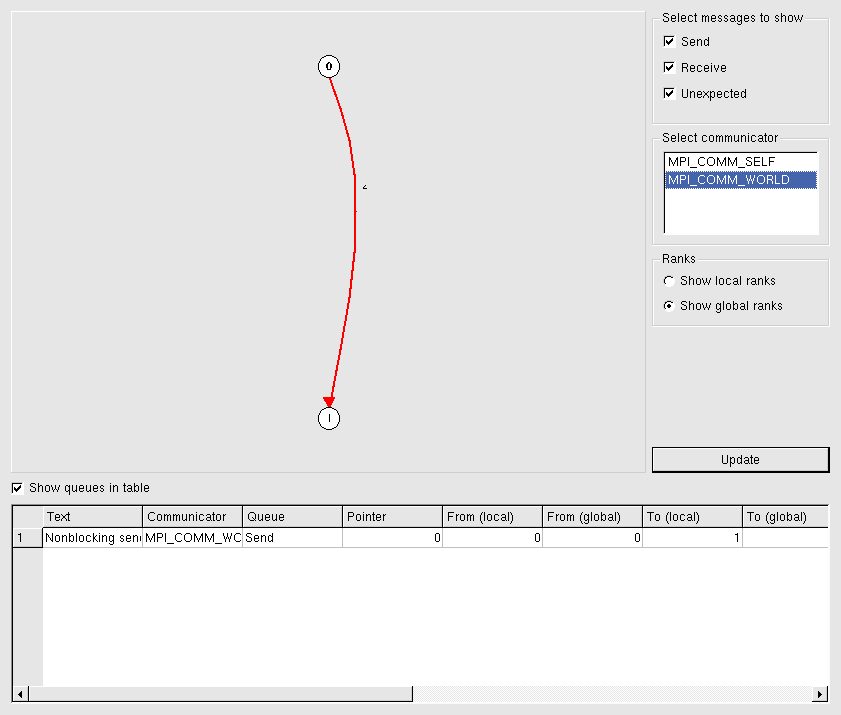
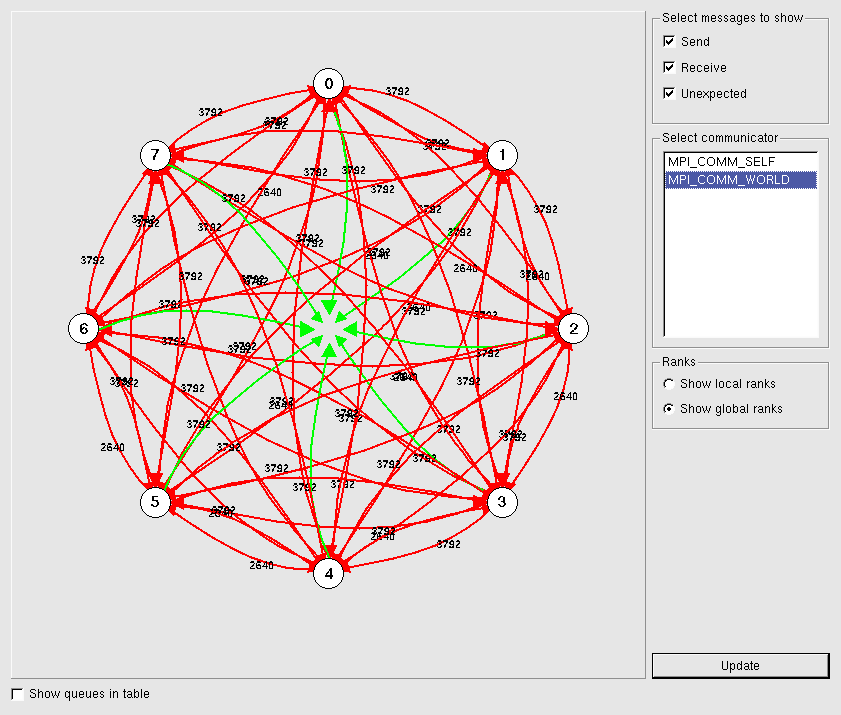
- View -> Message Queues (older versions), or Tools -> Message Queues in newer versions, in the control panel.
- Produces both a graphical view and a table for all active communications.
- Helps to debug such MPI problems as deadlocks etc.
Memory Debugging
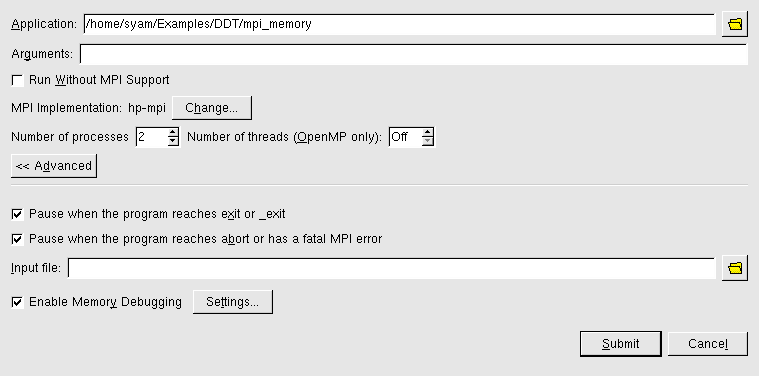
- Can intercept memory allocation and de-allocation calls and perform lots of complex heap- and bounds- checking.
- Off by default, can be turned on before starting a debugging session (in Advanced settings).
- Different levels of memory debugging – from minimal to high.
- On error, stops with a message like
- Check Validity
- In Evaluate window, right-click to "Check pointer is valid"
- Useful for checking function arguments
- Detecting memory leaks
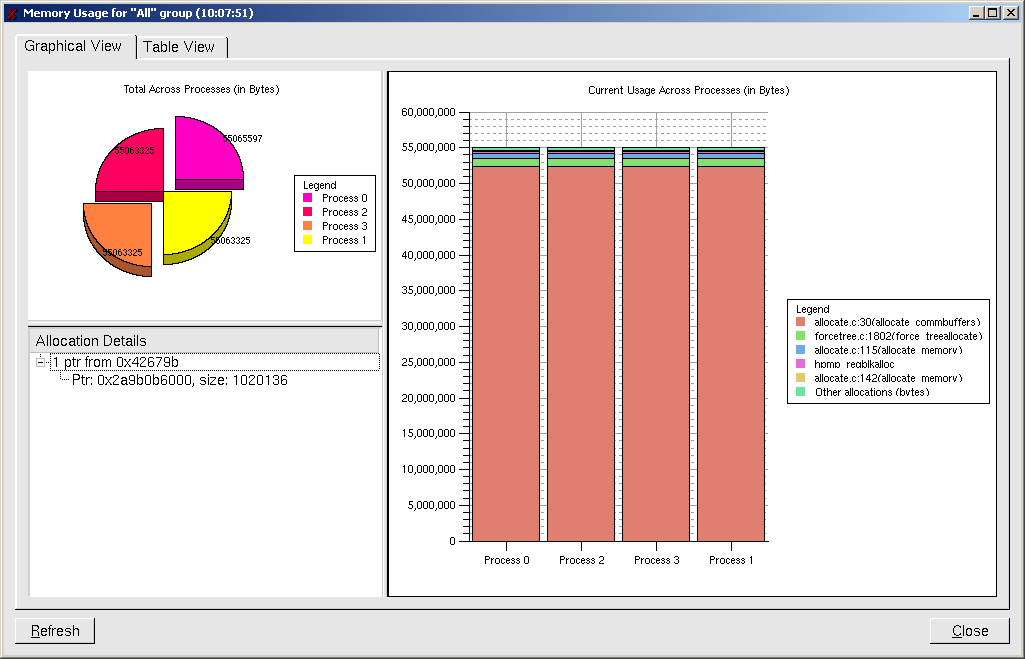
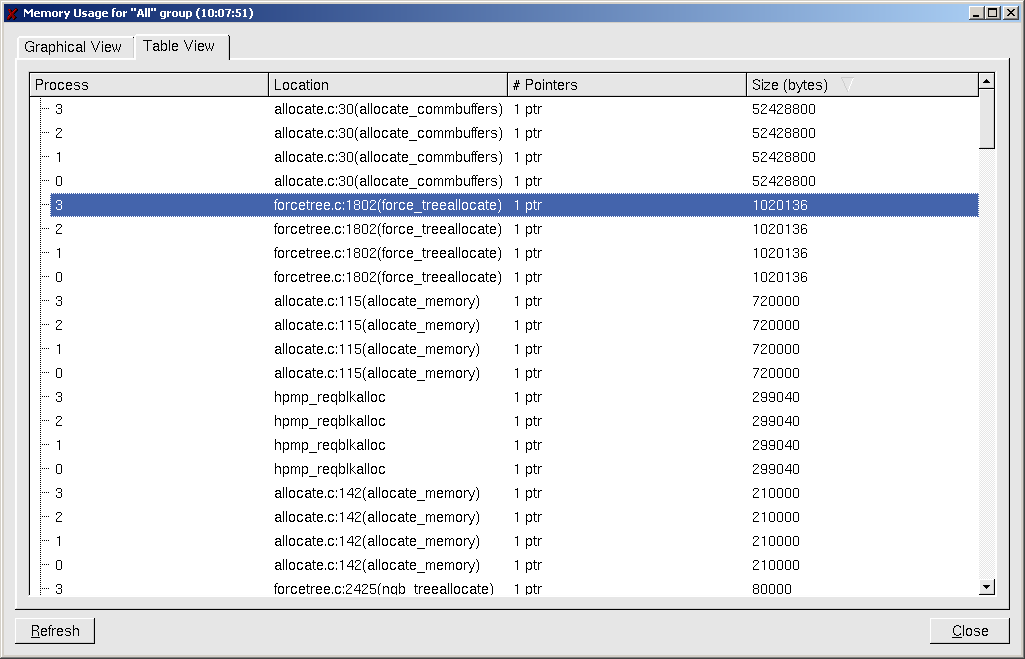
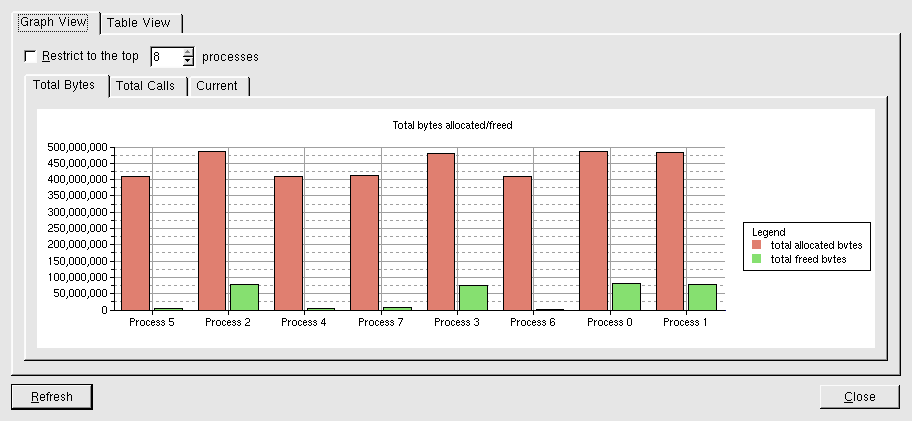
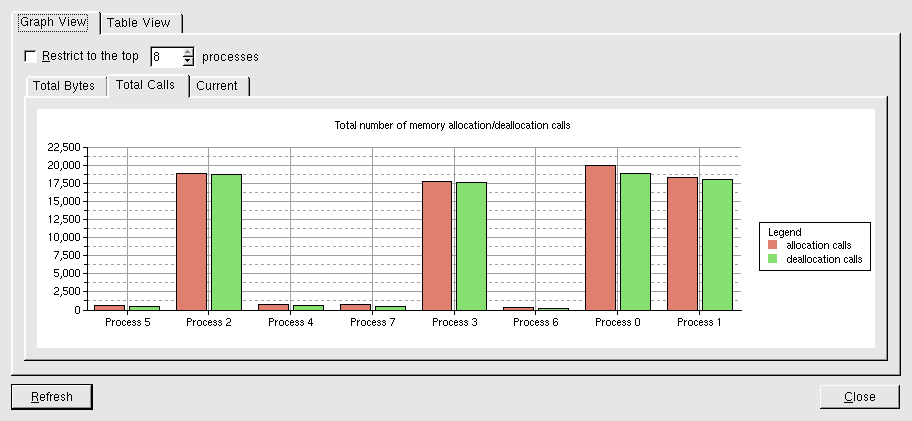
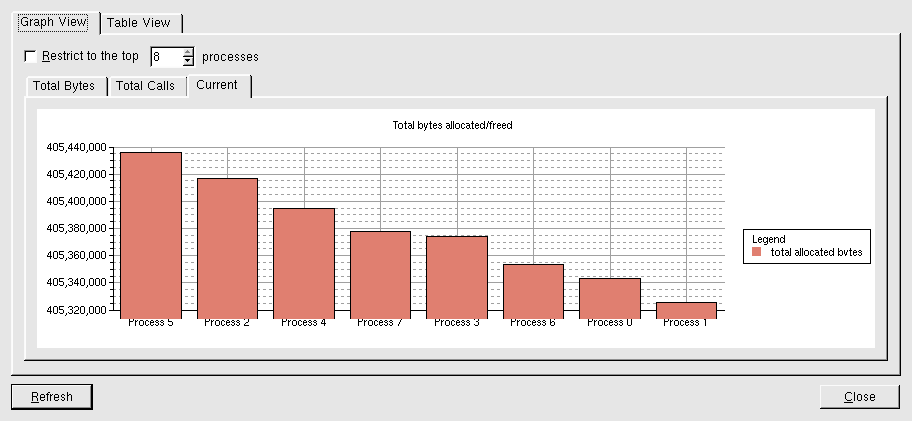
- "View->Current Memory Usage" window (Tools->Current Memory Usage in newer versions)
- Shows current memory usage across processes in the group
- Click on a color bar to get allocation details
- For more details, choose "Table View"
- Memory Statistics
- Menu option "View->Overall Memory Stats" ("Tools->Overall Memory Stats" in newer versions).
Debugging OpenMP programs
- The current version of DDT has almost the same OpenMP functionality as for MPI:
- Single click access to threads
- Viewing stacks in parallel
- Setting thread-specific breakpoints
- Compare expressions across threads, etc
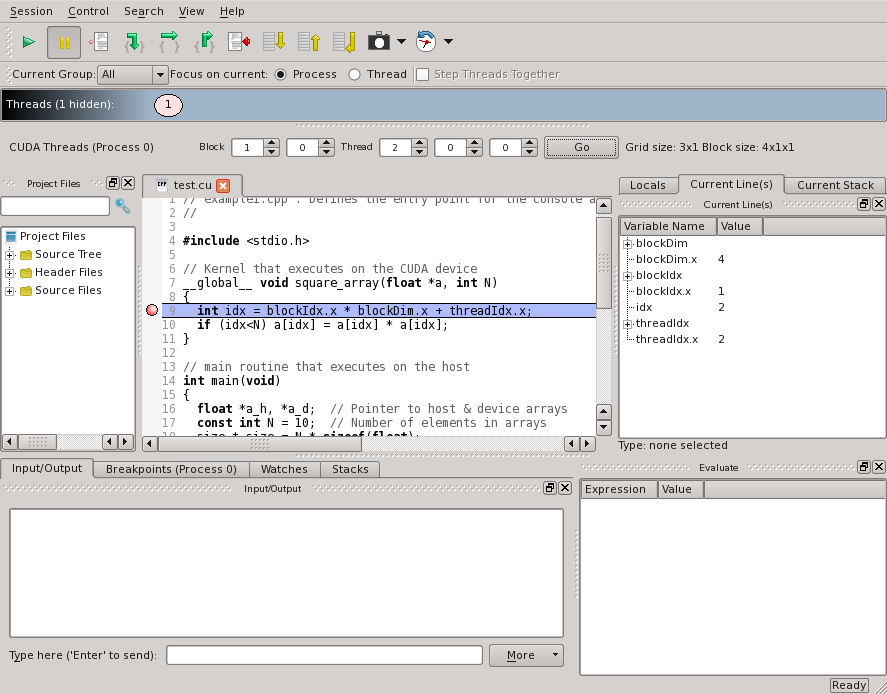
Debugging GPU programs
- Compilation instructions were given earlier.
- Can be a mixed MPI/CUDA code, but can only use one CPU and one GPU per node, up to 8 nodes.
